Your coding agent gets worse as its context fills.
contextrot proves it on your own sessions — and tells you exactly what to change.


uvx contextrotor, with plain pip (Python 3.9+ — including the stock python3 on macOS):
pip3 install contextrot
contextrot
contextrot: command not foundafter pip install? Your Python scripts directory isn't onPATH(common with the stock macOSpython3). Either useuvx contextrotabove, or run it PATH-free withpython3 -m contextrot.
That's it. No config, no API keys, no uploads. contextrot reads the session transcripts your agent CLI already keeps on disk and answers a question no other tool answers:
At what context fill does my agent start failing, what's causing it, and what is it costing me?
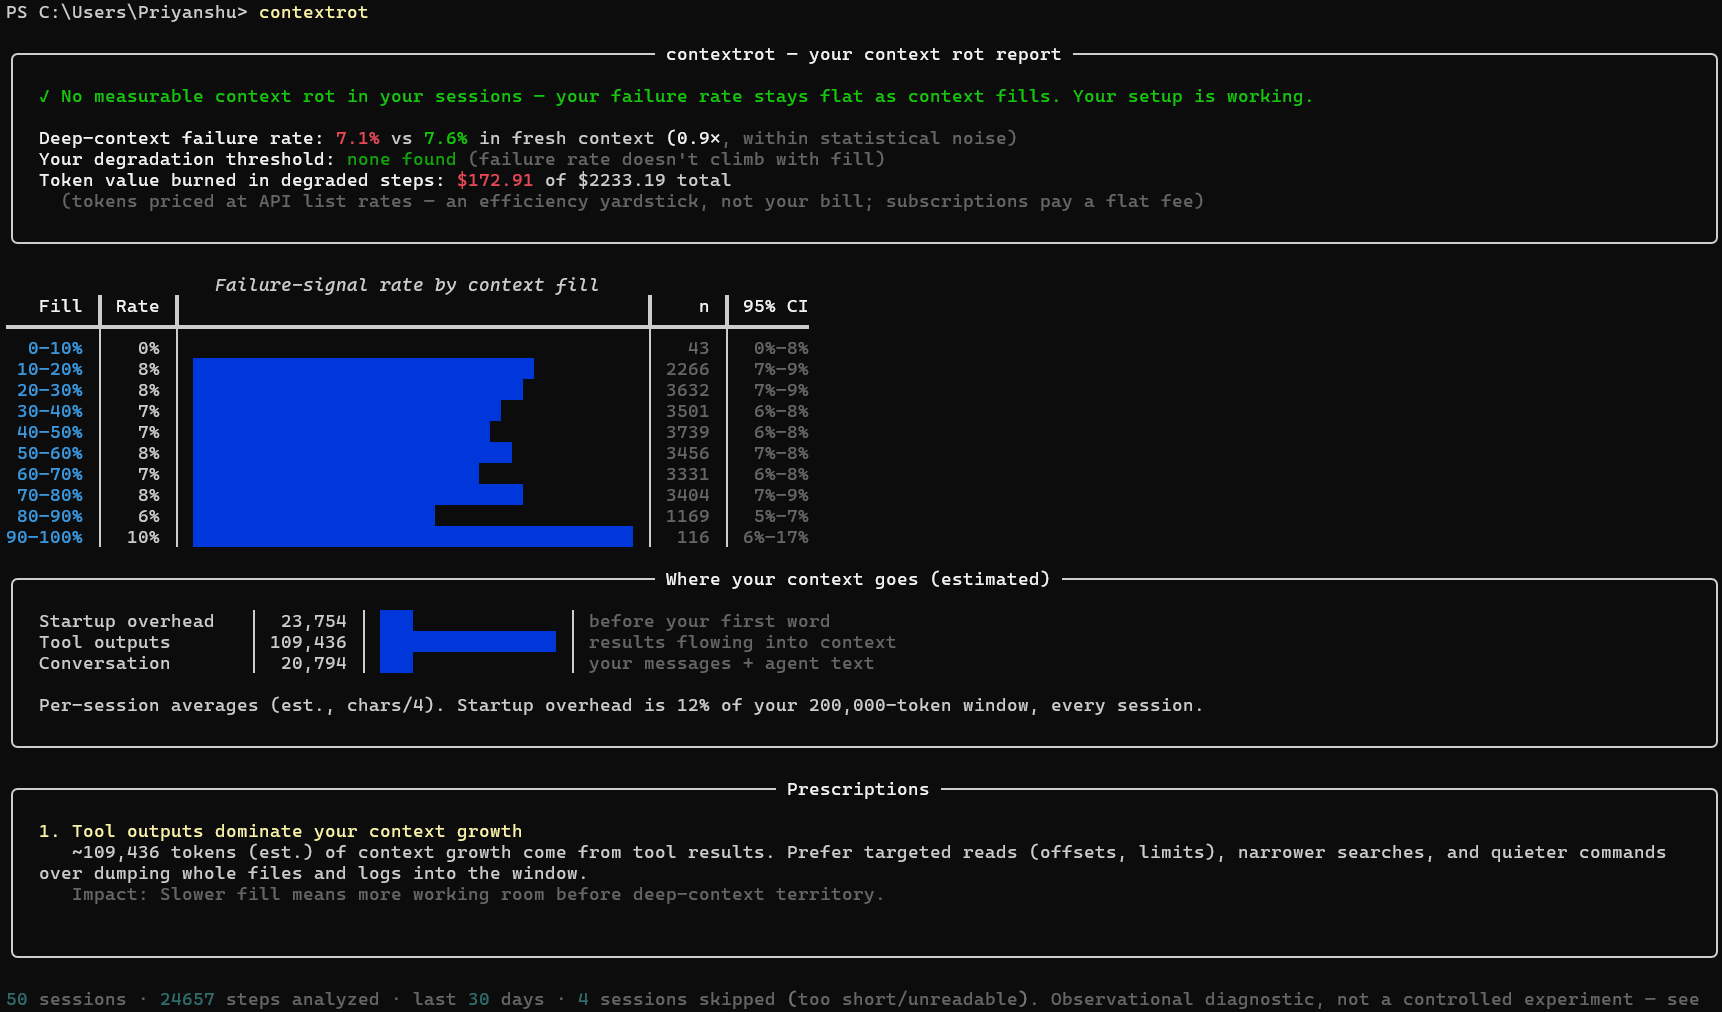
Every report leads with a plain verdict — one of four honest answers:
| Verdict | Meaning |
|---|---|
| ✗ Context rot detected | your failure rate climbs significantly as context fills |
| ! Edge rot | flat until near the window limit, then it climbs — compact before you get there |
| ✓ No measurable rot | your failure rate stays flat; your setup is working |
| ? Not enough data | keep using your agent and re-run |
A tool that can say "you're fine" is a tool you can trust when it says you're not.
Research (Chroma's context-rot report, several 2026 papers) shows LLM output quality degrades as input context grows — even far below the window limit. But that research runs synthetic tasks in lab conditions. Your degradation point depends on your projects, your MCP setup, your model, your prompting style.
contextrot measures it where it actually matters: in your own sessions.
Agent CLIs like Claude Code log every session to local JSONL transcripts. Each step carries token accounting and behavioral evidence. contextrot extracts five independent failure signals per step and correlates them with context fill at that moment:
| Signal | What it catches |
|---|---|
| Edit failures | the agent tried to edit code and missed — the clearest "lost track of file state" event |
| Retry loops | the same tool call repeated after an error: paying twice for one action |
| Re-reads | re-reading files it already read — content scrolled out of effective attention |
| Self-corrections | "I apologize, let me fix that" |
| Tool errors | any failed tool call |
Statistics are kept honest: Wilson 95% confidence intervals, per-signal breakdowns, visible n-counts, and a degradation threshold that only gets declared when a bucket's confidence floor clears the baseline — one noisy bucket can't scare you. Full method: docs/methodology.md.
Use more than one model? The report also compares them head-to-head — an independent rot curve and verdict per model family (Opus vs Sonnet vs Haiku), on a shared scale, so you can see which model degrades first for your workload.
Work across several repos? contextrot projects does the same head-to-head by project — an independent rot curve and verdict per working directory, ranked by size, so the specific repo whose CLAUDE.md or MCP setup is dragging you down stops hiding inside your all-projects average.
Use more than one coding agent? contextrot agents compares them too — Claude Code vs Codex CLI vs Gemini CLI vs Cline, each with its own curve and verdict on a shared scale, measured on your workload rather than a benchmark's.
contextrot                      # full report, last 30 days
contextrot --days 90            # more history = tighter statistics
contextrot -p myproject         # one project only
contextrot --html report.html   # shareable single-file report (still 100% local)
                                #   includes a 1200×630 share card — save as PNG,
                                #   post it; and a per-model comparison when you
                                #   use more than one model
contextrot --json               # every number, recomputable
contextrot projects             # rank your projects — which repo rots first
contextrot agents               # rank your coding agents — which CLI rots first
contextrot install statusline   # live context-health segment in Claude Code's
                                #   statusline, colored by YOUR measured curve
                                #   (dry-run by default; --apply to write)
contextrot install hook         # one-time in-session warning when you cross
                                #   your measured degradation threshold
contextrot mcp                  # MCP stdio server — let any MCP-capable agent
                                #   query your rot report mid-session
                                #   (claude mcp add contextrot -- contextrot mcp)
contextrot trends               # week-over-week: is your hygiene improving?
                                #   (the before/after check for `fix`)
contextrot fix                  # dry-run: prescriptions + unused MCP servers +
                                #   CLAUDE.md size. Add --apply to disable unused
                                #   *global* MCP servers (backs up first, reversible)
contextrot badge                # local SVG verdict badge for your README —
                                #   no badge service sees your data
contextrot sessions # list what was parsedThe report tells you where you degrade; the statusline tells you while it's
happening. After contextrot install statusline --apply, Claude Code's
status bar shows your current context fill colored against your own measured
curve — not a generic "yellow at 70%":
ctx 72% ███████░░░ · ▲ past your knee (~70%) · fail here 4.8% (1.5× fresh)
Every plain contextrot run recalibrates it from your latest data. Other
statusline tools show cost and a hardcoded threshold; this one knows where
you start failing. Dry-run by default, backed up, reversible with
contextrot uninstall statusline.
Prefer an active nudge over a passive bar? contextrot install hook registers
a PostToolUse hook that warns once — the moment a session crosses your
measured threshold — then stays quiet until the next crossing. If your curve
has no knee, it says nothing at all: no generic scare thresholds.
| Tool | Question it answers | What it can't tell you |
|---|---|---|
| ccusage | "How much did I spend?" | anything about output quality — use both, they're complementary |
Claude Code /context |
"What's in my window right now?" | no outcomes, no history, no correlation |
| Langfuse / Phoenix / MLflow | "How is the app I built behaving?" | require instrumentation; contextrot analyzes the agent you use, zero setup |
| Chroma's research | "Do models degrade on benchmarks?" | nothing about your workload — contextrot is the personal-data counterpart |
The report says $2,000+ but I'm on a $20/month subscription. Is it broken? No — that figure is the token value of your usage priced at API list rates, labeled as such in the report. It exists because tokens are the resource that fills your context window and burns your rate limits, and dollars are the only unit everyone reads instantly. Two honest readings: it's what your usage would cost pay-per-token (enjoy your subscription), and the "burned in degraded steps" share is the fraction of that resource going to rework. It is not, and never claims to be, your bill.
Why is the token flow so large? Agents re-send the entire conversation to the model on every step. A 100-step session at 100k context ≈ 10M tokens flowing through — mostly cache reads. That's normal; it's also exactly why context bloat matters.
Correlation isn't causation, right? Right, and the report says so on its face. Deep-context steps are also later-in-task steps. contextrot is an observational diagnostic with conservative statistics, not a lab experiment — see methodology.
What about my privacy? contextrot makes zero network calls. Local files in, terminal/local HTML out. Grep the codebase for an HTTP client — there isn't one.
| Agent | Status |
|---|---|
| Claude Code | ✅ today |
| OpenCode | ✅ today — community-contributed |
| Codex CLI | ✅ today |
| Gemini CLI | ✅ today |
| Qwen Code | ✅ today — same recording format as Gemini CLI |
| Cline (VS Code) | ✅ today |
| Roo Code (VS Code) | ✅ today |
| Kilo Code (VS Code) | ✅ today |
| Kiro CLI | ❌ blocked upstream — its transcripts record no token counts, so context fill can't be computed |
| OpenTelemetry GenAI spans | planned |
An adapter is one small file with a fixture and a test — it's the paved first-contribution path.
- ✅
contextrot fix(0.6.0) — dry-run prescriptions + unused-MCP-server detection, reversible--apply - ✅ Adapter wave (0.6.1–0.7.0) — Codex CLI, Gemini CLI, Qwen Code, Cline, Roo Code, Kilo Code + per-agent comparison
- ✅ Live surfaces (0.8.0–0.10.0) — calibrated Claude Code statusline, knee-crossing warning hook, MCP server for any agent
- ✅
contextrot trends(0.11.0) — week-over-week before/after measurement forfix - OpenTelemetry GenAI span ingestion
- Opt-in, anonymized aggregate stats → the State of Context Rot report: real-workload degradation curves across the community (off by default, aggregate-only, documented schema)
See CONTRIBUTING.md. Most valuable first PR: an adapter for the agent CLI you use — there are spec'd, ready-to-pick-up adapter issues waiting.
Ran the tool? Share your rot curve — flat curves count too.


Live dashboards: pypistats · clickpy (ClickHouse)
If contextrot told you something useful about your setup, a ⭐ helps other agent users find it.