### Version 4.7.0 ### Steps to reproduce ``` visualMap:{ show:false, dimension: 1, pieces: [ {gte:-10,lte:0,color:'#8bc34a'}, {gt:0,lte:20,color:'#ff5722'}, ] }, ``` ### What is expected? 在值为大于-10小于等于0的区间,折线应该显示为绿色 ### What is actually happening? 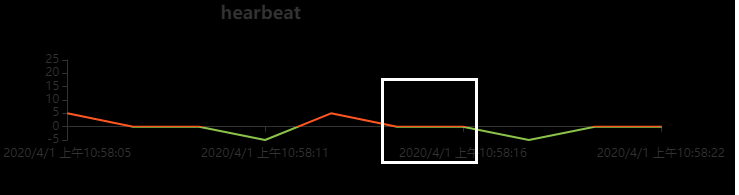 实际上在值为0时折线颜色是红色和绿色重叠混合的色值 使用{value: 0,color:'#8bc34a'}指定特定值的颜色也不起效 <!-- This issue is generated by echarts-issue-helper. DO NOT REMOVE -->
Version
4.7.0
Steps to reproduce
What is expected?
在值为大于-10小于等于0的区间,折线应该显示为绿色
What is actually happening?
实际上在值为0时折线颜色是红色和绿色重叠混合的色值
使用{value: 0,color:'#8bc34a'}指定特定值的颜色也不起效